{ memory }

  • Heap Corruption Follow-up: Size, Alignment, and Crashing Collections

    Alignment and buffers and tails, oh my!

    Posted on by Greg Heo

    Tags:

    After a massive multi-day effort, our team found one of those rare bugs that turned out to be an issue deep in the compiler. My colleague Agnes took the lead to track down the issue and wrote up her findings about her adventures.

    Now that the issue is fixed and the hard work is done, I can step in and do a little post-mortem. 🔎 What was the problem? What was the fix? What did we learn?

    Smashing the Stack

    The classic article “Smashing the Stack for Fun and Profit” from 1996 outlines a technique to execute arbitrary (and possibly malicious) code via a program that doesn’t do proper bounds checking. In the 20 years since, operating systems and programmers have become much more clever about stopping these exploits.

    Sometimes though we’re our own worst enemies — reading past the last element of an array or an off-by-one error that writes past the end of a buffer is as easy to do as it was 20 years ago.

    In our case, we were getting heap corruption errors, meaning something was accessing memory it shouldn’t be accessing. But Swift is a safe language, isn’t it? How was this possible?

    To get to the root cause, we first need to understand two concepts: memory layout, and tail allocation.

    Memory Layout

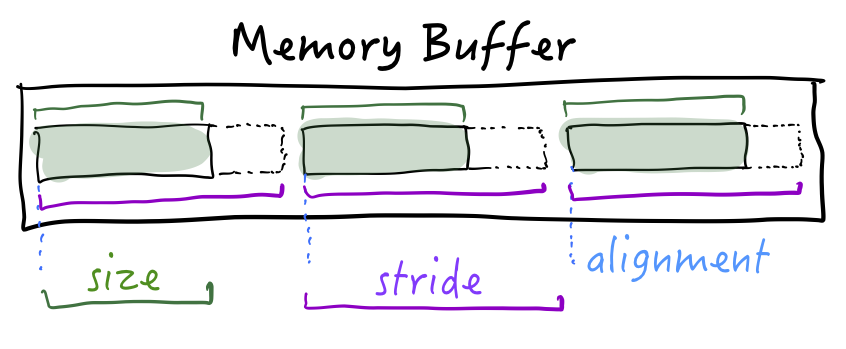
    When instances are laid out in memory, there are several numbers to consider:

    Size is the number of bytes to read so you have all the useful information.

    Stride is the distance between two values. If you have a contiguous array of items, the stride is the number of bytes to advance to reach the next value.

    Alignment helps determine where in memory your data can start. Depending on the type and the CPU, you could have requirements such as “data must start at an even memory address” or “data must start at a multiple of 8”.

    Size, stride, and alignment diagram

    If you want a longer discussion and more examples of memory layout, check out my article about Size, Stride, and Alignment in Swift.

    Tail Allocation

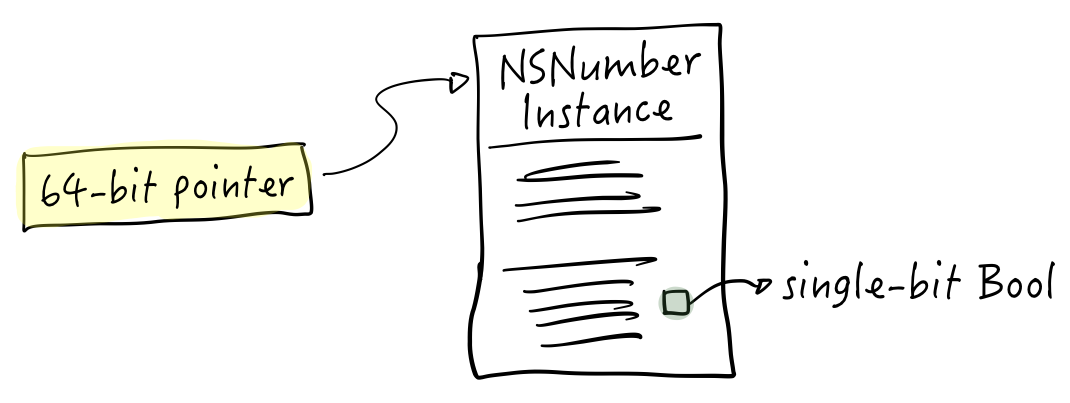
    Do you remember tagged pointers from the Objective-C days? The idea was: why spin up an entire object just to hold something like an NSNumber containing a boolean? A boolean is a single bit, after all.

    Pointer to an object that stores a Boolean value

    So on a 64-bit system, a pointer to an object takes 64-bits. But forget the pointer, we could store entire values with room to spare in 64 bits. Booleans, integers, even short strings could fit.

    What a tagged pointer with a Boolean value might look like

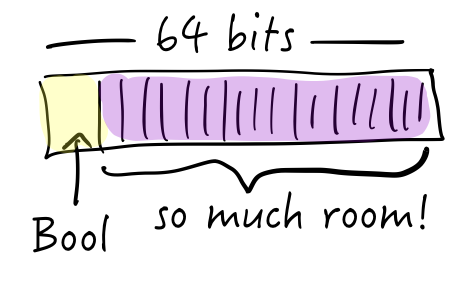
    It’s a size optimization — although we could in theory address 264 bytes of memory (that’s 18 exabytes, or a 18 million terabytes), that’s overkill, isn’t it? Why not use a few bits for flags, leave enough space to address memory, and then you can support features like tagged pointers.

    Similarly, when you allocate something like an array or dictionary in Swift you get a little extra space at the end.

    Sometimes this is due to alignment: since the next thing in memory needs to spaced out a bit more, why not use that blank space “between” size and stride? Other times, the system might reserve a little extra space for expansion so you don’t need to do an expensive re-allocation and copy later. This extra space is the tail allocation.

    Thanks to Karoly Lorentey for explaining tail allocation to me via Twitter.

    Size, Alignment, and Crashing Collections

    Now, on with the story.

    Let’s say you want an array in Swift. The runtime goes ahead and allocates some space, and also adds on some tail-allocated space. Here’s the method that does the work:

    1
    2
    3
    4
    llvm::Value *irgen::appendSizeForTailAllocatedArrays(
    IRGenFunction &IGF,
    llvm::Value *size,
    TailArraysRef TailArrays)

    We’re passing in an llvm::Value for the size, and the function returns another llvm::Value representing the new total size. For example, you ask for a 44-byte array and the function returns a value of 48 to round it up to a multiple of 8. That’s four extra bytes of tail-allocated storage!

    In practice, the system might add enough space for a few extra elements rather than just the “rounded up” space due to alignment.

    Big Data

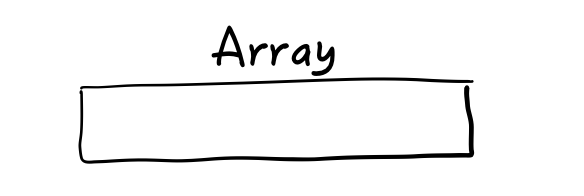
    So, let’s say we have a array. We allocate enough space for some values:

    Space for a array

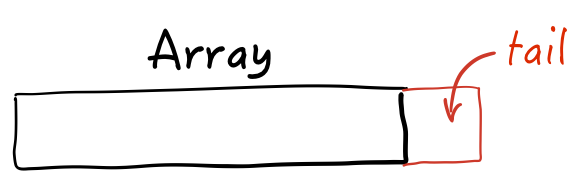
    Then the compiler helpfully adds on tail-allocated storage, enough to hold an additional value:

    Tail-allocated space

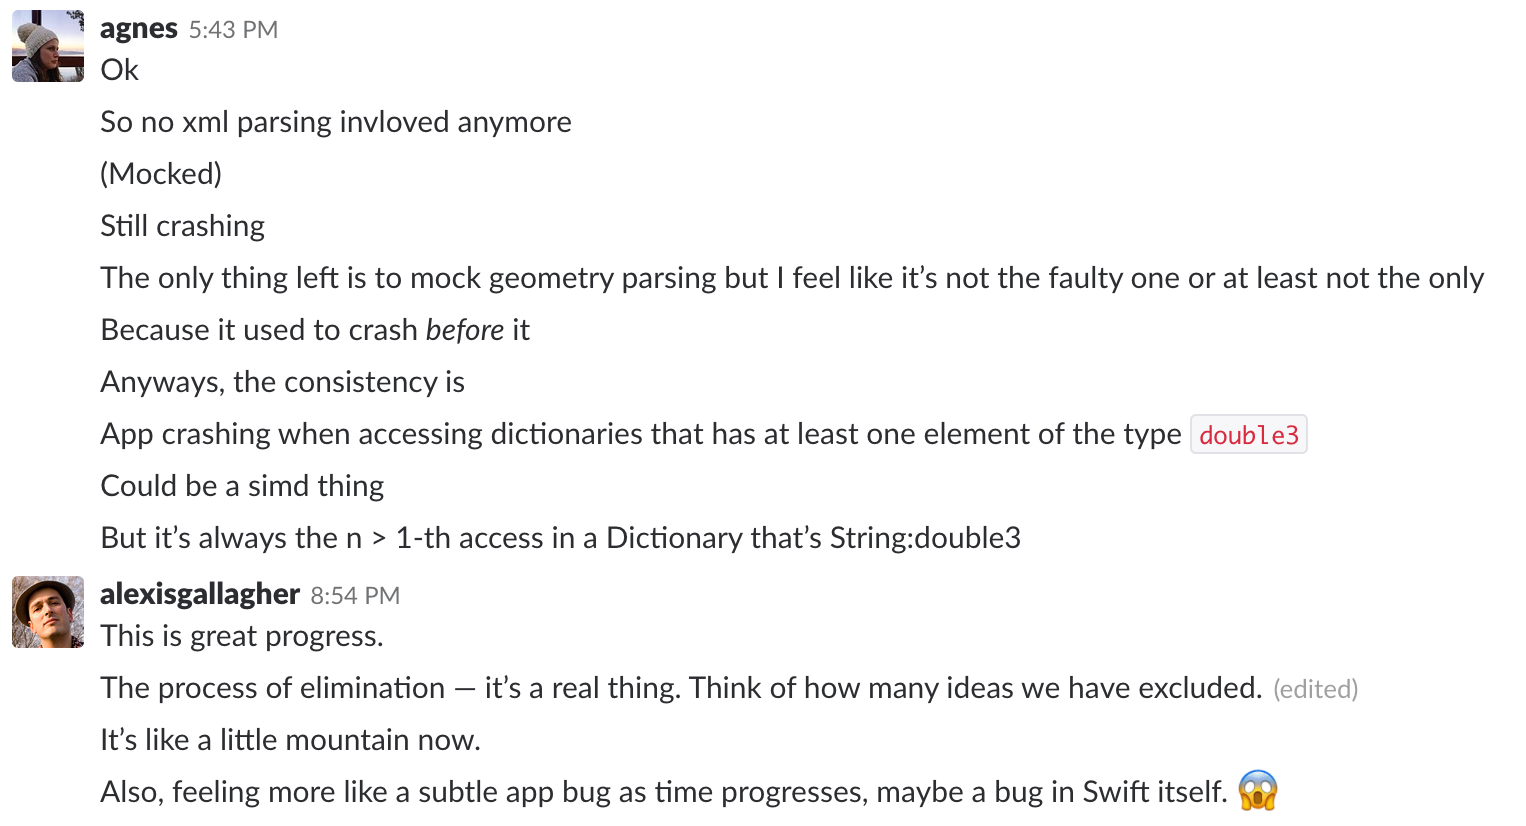
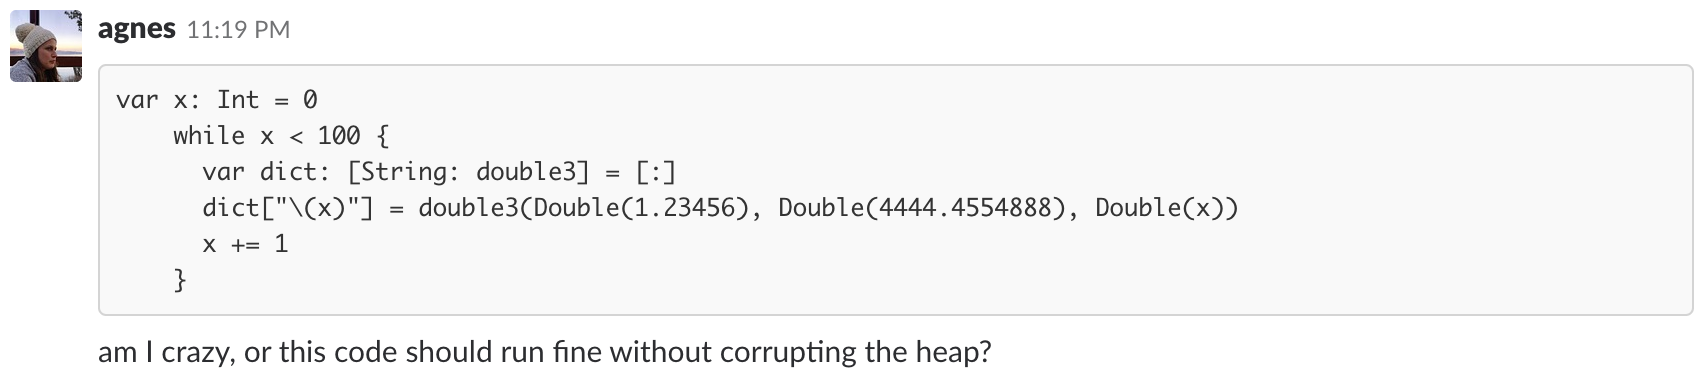
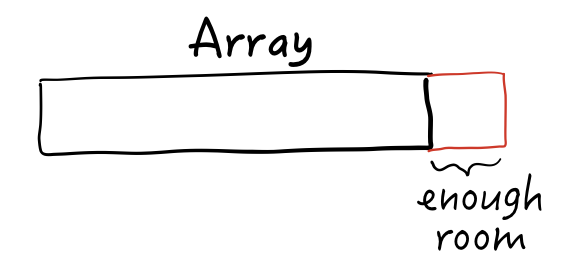
    Now here’s the kicker: in our app, we’re storing values of double3 type. A double3 has a size and alignment of 32 bytes. But a 32-byte type will certainly fit in the tail-allocated space:

    Looks like there's enough room

    But it may not be aligned properly. At runtime, if the array decides to use its tail-allocated space it will also make sure to write that value to a 32-byte alignment boundary:

    Buffer overflow in tail-allocated space

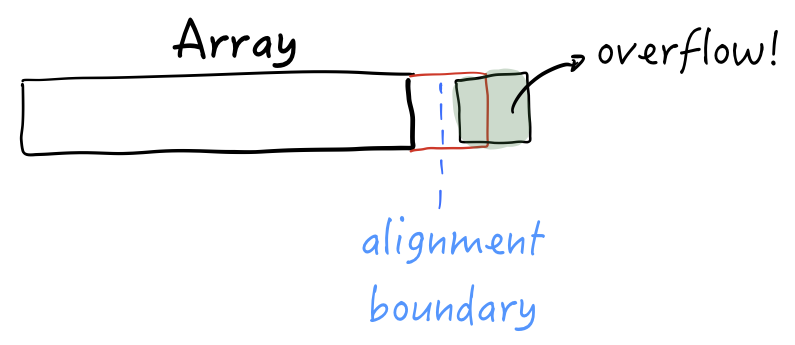
    The tail-allocated size is sufficient, but the system didn’t take alignment into account. The alignment boundary we need is not at the start of the tail allocation.

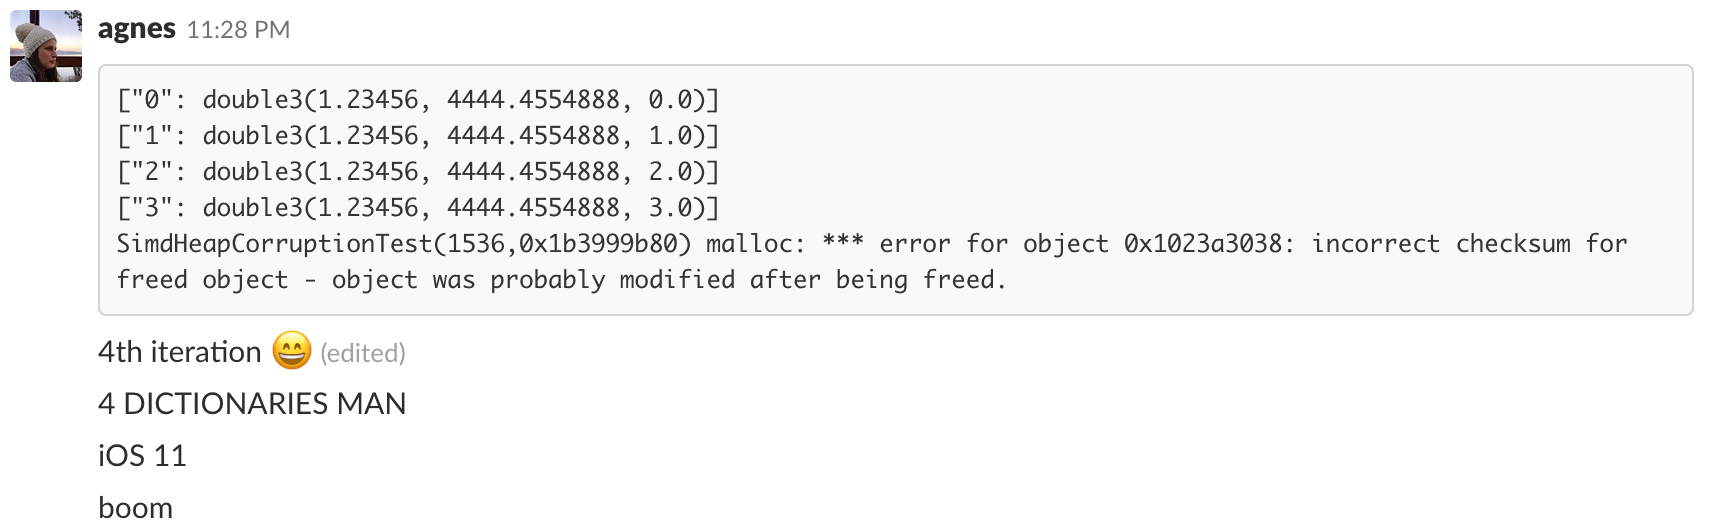
    The result? A buffer overflow. Corrupted heap. 💥

    Alignment All the Way Down

    What were the problems and solution here? Two things:

    1. What gets stored in the tail-allocated space will affect the alignment of the entire type.

      In the method declaration above, you saw how you pass in a size and get back a size. If you look at the commit that fixes the issue, the method now returns both a size and an alignment as a pair (aka a two-element tuple).

      This change recognizes both size and alignment of the tail-allocated space when determining size and alignment of the overall space.

    2. On Apple platforms, heap allocations are aligned on 16-byte boundaries.

      That means your types that are 1, 2, 4, 8, and 16 bytes wide are also aligned. But a double3 needs to be 32-byte aligned. This second commit updates the runtime to call AlignedAlloc() rather than malloc() to ensure proper alignment.

    A big round of thanks to Erik Eckstein, Arnold Schwaighofer, Mike Ash, and Jordan Rose for their work and reviews on the two pull requests.

    Final Lessons

    I’m not a compiler engineer and I don’t know all the details about this bug, but I’m a firm believer in the value of reading code — especially code you don’t understand yet.

    Agnes wrote a great summary of her lessons learned while tracking down this bug; what things can I add after digging a bit more into this problem?

    1. Keep code distance short.

      Tail allocation is a relatively new feature. It sort of bolts on top of the usual allocation flow, and there’s more code to follow and to understand to trace the thing end to end.

      Sometimes this is a problem in my own code. Do classes have high levels of cohesion? Are related things close together, or separated by many frameworks and modules? How many files are there to go through and how big is the stack trace to understand some area of the code?

    2. Learn how to trace values back in time.

      Agnes covered the magic of going back in time (via TestFlight builds and version control) as a debugging tool.

      Within your codebase, can you pick a variable and see its changes as it moves through your program? If the alignment is 1 at the beginning and 16 by the end, why? And how? Why isn’t it the correct value of 32? If the buffer looks correct before adding data and then has data written past the end after initialization, why? And how?

      Learning how to use breakpoints, watchpoints, conditional breakpoints, etc. is invaluable here as you trace values over time.

    Although it was tough work to track down this bug, I had a fun time doing a little digging after the fact on the cause and fix. I’m super impressed at how quickly it was fixed in the compiler and now look forward to the months ahead of a completely bug-free system. 😉


    Thanks to my colleagues Agnes and Alexis for their help reviewing this article. All remaining errors are of course intentional and meant to test your attention. 😜

    If you have questions or feedback for me, you can get in touch via Twitter where I’m @gregheo. If you’re interested in working with us — we’re hiring, and looking for an expert iOS developer. You could be working on the future of AR on iOS and writing about it on this fine company engineering blog!

  • Solving a Mysterious Heap Corruption Crash

    Or, how to track down a subtle Swift compiler bug

    Posted on by Agnes Vasarhelyi

    Tags:

    A while back, we noticed an increase in crashes in our app. The crashes were marked as heap corruption, which makes them hard to debug — the location given in the stack trace (if any) can be far away in both code and time to where the problem actually lies.

    After a long investigation down many paths, it turned out to be an issue in Swift itself. After sharing a few tweets about it on Twitter, I had a lot of people asking me for more details, so here I am, sharing the story of the mighty heap corruption issue.

    Are you ready for a tale of woe, frustration, and ultimately, redemption? Are you curious about how other iOS teams — ours, in this case — investigate and track down bugs? Read on.

    First, let’s have a look at what heap corruption is

    Heap corruption occurs when dynamic allocation of memory is not handled properly. Typical heap corruption problems are reading, or writing outside of the bounds of allocated memory, or double-freeing memory. Since the result (e.g. a hard crash) can happen later, when the program tries to manipulate the incorrectly allocated piece of memory, the root cause of the issue can remain hidden from your eyes.

    Gathering signal with crash reporting

    It all started with reports from Crashlytics about an increasing number of heap corruption issues. The content of the issues was not helpful, because where it crashes has little relation to where the real problem is.

    Once the number of these issues started increasing we started getting more and more nervous. Crash-free user sessions went down from almost 100% to 96% in a few months. 😨

    The increase in crashes lined up with a Crashlytics SDK update, so I started by asking if anything might have changed on their end:

    Perhaps it was improved issue tracking? Maybe they enabled something that now sends us all the exceptions thrown from system libraries?

    They were quick to respond and the answer was a definitive no. The problem was indeed our problem, and it had nothing to do with any change at Crashlytics. ✅

    Try to reproduce the issue

    By looking at the device types I realized we only had crashes on iOS 11 and only on older devices — iPhone 6, 6 Plus, 5S, SE, latest iPod touch 6 and iPad Mini.

    Unfortunately, our older test devices in the office were all on iOS 10! We probably hadn’t tested the app on iOS 11 on any of these devices, ever.

    Lining up the crashes with analytics events, it looked like the app crashed once people opened our Try On view, the AR view where you try on your Topology glasses. This seemed reasonable, as that screen is a heavy one full of Scene Kit and Metal, allocating significantly more memory than other parts of the app.

    We were able to reproduce this crash ourselves, which was a great first step. Now we could start investigating which part of the code was the problem.

    Go back in time

    The classic way to track down the source of a bug is to bisect. Try a version of your app from last month, see if it crashes, and then try another one either before or after that. Eventually with enough tries, you can narrow it down to an exact commit.

    I found a version of our app from eight months ago, before iOS 11 was introduced, and ran it on an affected iOS 11 device. It still crashed. ✅

    The eight month old app was fine running on iOS 10 but not on iOS 11. Conclusion: something changed in iOS 11 to trigger the crash. Our working hypothesis was that iOS 11 uses more memory than iOS 10, and the increased memory pressure causes the app to crash on older devices.

    Challenge every assumption

    The team had a suggestion for me to validate the hypothesis: run the app on an iOS 11 iPhone 7, and get it to crash.

    If memory pressure was the issue, I could malloc big chunks of memory and then enter our Try On view. No crash.

    Our hypothesis was incorrect, but at least we had scratched off a strong possibility. ✅

    Analyze and slice the code

    At this point, we tried to think about how this problem could happen in the first place.

    We knew there was something in the app that mishandled memory in a way that it corrupted the heap. Swift is mostly memory safe, so unless we were doing something exotic, we should be safe.

    However, we did have some exotic code in there to examine for issues:

    1. Incorrect pointer manipulation (like double freeing)

    We reviewed all our code doing raw pointer handling. We have some C++ code and some low-level graphics code, both being good candidates for incorrect pointer usage, but all turned out fine. ✅

    2. Thread data races

    There’s a great tool called the Thread Sanitizer built in to Xcode that helps you find data race issues in your app. Unfortunately, it only runs on the Simulator and much of our app uses features that are unsupported there. The parts that do run in the simulator worked just fine and didn’t trigger any Thread Sanitizer warnings.

    We manually tracked down every piece of concurrent code in our app, marking them as safe, or to be inspected. All turned out to be safe. ✅

    Now what? 😳

    Interlude

    “What if it’s a bug in iOS 11?” - Eric, our CEO

    Blaming the platform or the system frameworks is easy to do, but it’s such an unlikely occurrence. I just smiled at our CEO, saying “I don’t think so”, not knowing yet that he was very close to the truth.

    Even if we immediately jumped to the conclusion of a Swift bug, we still needed to find a reproducible case to file a bug report.

    “When in doubt, use brute force” — Ken Thompson

    Finally, I went to a tried and tested method: brute force. Also known as “ripping the app apart”. 🔪

    Remove third-party code

    I removed every third-party dependency, to exclude the possibility that the problem is not in our code. Luckily we’re very strict about not adding many third-party libraries and the ones we do have are mostly supporting easily isolatable code, like SSZipArchive.

    Still crashing. ✅

    Next, I removed our own framework of commonly used components.

    Still crashing. ✅

    Move suspicious pieces to an empty project

    I was pretty suspicious about the heavyweight AR view, so I pulled it out into its own project.

    Still crashing, great! ✅

    I had a wild idea and removed the whole AR view.

    Still crashing every second run. ✅ 😳

    Confusion was now at its peak level. 🤯

    If you get stuck, choose a new angle

    At this point my most solid theory of blaming the AR view was ruined, so I had to try another angle.

    The code was fairly slim at this point - a few thousand lines of parsing 3D models into all kinds of data structures. Nothing concurrent, everything running synchronously. I wanted to try and look at the crash site again. Even though I knew the cause of the heap corruption could be elsewhere, seeing the stack trace in the same piece of code every time made me want to look closer there.

    The pattern I started to see was that there was always a Dictionary involved, and there was always a simd type such as double3 in the dictionary.

    At this point, I was ready to give up after a week of this tiring hunt. 🏹🐞

    But what if.. what if it’s really a Swift bug? 🙀

    I opened up my MacBook again and tried something crazy.

    Ten minutes later:

    VICTORY! 🎊

    The Aftermath

    Finding the problem was a significant chunk of work, but that’s not the end of the journey. There are a few things to do after you finally figure out what’s going on.

    Workaround

    Because hey, your users are still out there, crashing. 😬

    For us, the workaround was to replace all double3 values to float3. After stress-testing dictionaries with float3 instead of double3 values, the app seemed to be stable.

    We still had no idea why double3 in dictionaries was a problem, but we wanted to submit a quick fix to the App Store. This part of the story has a happy ending: ever since the change landed we’re back at a 100% crash free session rate. 😎

    File a radar

    The folks at Apple might be unaware of the bug, and there might be lots of people out there crashing for the same reason. They need your help to know if there’s something like this going on.

    I’m lucky to have a friend and fellow Hungarian on the Swift standard library team, Karoly Lorentey, who reached out to me about the issue once I started tweeting about my progress. They were very excited about my findings, and once I submitted the bug report Erik Eckstein submitted a fix almost right away! The fix was shipped in Swift 4.1 and Xcode 9.3 beta 4.

    I can confirm that the version of our app that used to crash before does not crash when built with the new Xcode beta. 🎊

    Karoly was also kind enough to explain what the problem was, so let’s briefly go through the cause of all the heap corruption craziness.

    The actual problem

    The actual problem is not restricted to “old” devices. ❌
    Every platform, and every device is affected. ✅

    The actual problem is not Dictionary nor double3 specific. ❌
    All collection types are affected, when storing types with alignments greater than 16 bytes. ✅

    When their elements had unusually wide alignments, storage for the standard library’s collection types was not guaranteed to be always allocated with correct alignment. If the start of the storage did not fall on a suitable address, Dictionary rounded it up to the closest alignment boundary. This offset ensured correct alignment, but it also meant that the last Dictionary element may have ended up partially outside of the allocated buffer — leading to a form of buffer overflow. Some innocuous combination of OS/language/device parameters probably caused this issue to trigger more frequently — which is probably why it became noticeable on particular devices running iOS 11.

    What is alignment?

    Alignment defines the amount of padding needed to make data line up on “even” memory addresses. Processors are most efficient with memory access if your data is aligned properly; some can still work with unaligned addresses but there can be a performance hit. ARM is more strict for instance, unaligned accesses (when not allowed) will cause an alignment fault.

    The fact is, that not many of the Swift types have alignments greater than 16 bytes. The reason why this issue occurred in our app is because we are using simd types extensively. simd types tend to have wide alignments.

    Even though we tried debugging the problem with the Address Sanitizer and Instruments memory inspection, we never caught it. I wonder why. 🤷🏻‍♀️

    Lessons learned

    Identifying and fixing bugs is a big part of a software engineer’s job. We all know how to do it, but sometimes it’s nice to review some of the big-picture steps:

    • Make sure you’re gathering the correct signal.
    • Find a consistent reproduction case.
    • Bisect, or find another way to go back in time to track back the problem.
    • Analyze and slice the code, and always challenge your assumptions.
    • Work your way down to the smallest and simplest bit of problem code.
    • Document everything!

    In the end, I had a simple project that exercised the bug along with copious notes, more than enough to file a bug report with Apple.

    I learned that a methodical approach and a little brute force can wear down any problem.

    And finally, I learned that sometimes your CEO can be right. Sorry Eric. 😉


    If you have any questions, comments, or feedback regarding this article, you can find me on Twitter as @vasarhelyia. All very welcome. DMs are open, too. 💌
    Thanks to my lovely team for polishing this article! 💜

    There is a second part to this article coming up explaining what the problem was in more detail and how the Swift team at Apple solved it. 🤓 Stay tuned!

Topology makes custom eyeglasses and sunglasses, perfectly sculpted to fit one person at a time. Our app combines video capture, 3D rendering, and Core Motion (among other things) to create a premium experience for our users. Sound interesting? We’re hiring, please get in touch!

© 2017–2018 - Topology Eyewear